Google Adds Custom Annotations To Search Console Performance Reports
Google has started rolling out a long-awaited upgrade to Search Console: custom annotations inside the Performance reports. The feature was first spotted in testing around May, and as of November 17, 2025, it is now becoming available to all properties.
In simple terms, annotations let you attach small notes to specific dates on your performance charts. Instead of trying to remember “What did we change that week?”, you can now mark those events directly in Search Console itself.
What exactly has Google launched?
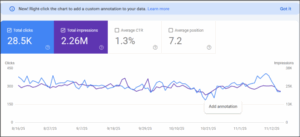
When you open a Performance report in Search Console, you may now see a label at the top saying something like:
“New! Right-click the chart to add a custom annotation to your data.”
From there, you can right-click on a point in the chart and add a short note explaining what happened on that date, for example:
- Site redesign went live
- Core update confirmed
- Major bug fixed
- New content hub launched
This has been posted by Google on LinkedIn and in its blog.
Google allows up to 200 annotations per property. You can delete an annotation if you no longer need it, but you can’t edit an existing one right now; you’d need to delete and recreate it. Also, annotations are automatically removed by Google after 500 days, so they don’t live there forever.
System vs custom annotations
Google’s documentation and the article highlight that there are now two types of annotations:
- System annotations: Created automatically by Google when there are known issues or changes in data processing and reporting. These help explain oddities in the charts that come from Google’s side.
- Custom annotations: Notes you add yourself to mark events specific to your site, such as launches, fixes, migrations, or big campaign pushes.
These annotations appear directly on the charts for the selected date and are visible regardless of the filters you apply. However, they won’t show up in comparison mode or 24-hour (hourly) views, so you’ll mainly see them in standard date-range graph views.
Why this matters for SEOs and site owners
For SEOs, this is one of those small but very useful quality-of-life upgrades. Until now, most teams tracked important changes in external tools, spreadsheets, or analytics platforms that supported annotations. Now you can keep that context inside Search Console, right where you’re looking at clicks, impressions, CTR, and position.
This lets you connect shifts in website traffic directly to particular events on your site. You can maintain a clear log of technical changes, deployments, and how problems were fixed. It also makes conversations about “what happened?” much easier. among SEO, content, and development teams.
Several SEOs have already shared positive reactions, calling it a helpful improvement for doing proper cause-and-effect analysis and keeping better historical records in GSC.
Privacy and sharing considerations
One important detail: annotations are shared with all users who have access to that property in Search Console. That means, if you leave a note, everyone associated with that property will be able to read it.
Because of that, Google warns against including any Personally Identifiable Information (PII) in your notes, so no names, phone numbers, addresses, or sensitive internal business details. Think of annotations as shared project notes, not private comments.
A small but meaningful upgrade
Custom annotations may feel like a simple feature, especially since many third-party tools have offered similar options for years. But bringing this capability directly into Google Search Console makes everyday SEO work a bit more grounded and transparent.
Now, when you look back at a chart six months from now and notice a big shift, you’re less likely to be guessing. A quick hover over an annotation can remind you exactly what changed on that date, which is exactly the kind of context most of us wish we’d written down earlier.